How to Trade Crypto on Bitunix
How to Trade Spot On Bitunix (Web)
What is Spot trading?
Spot trading is between two different cryptocurrencies, using one of the currencies to purchase other currencies. The trading rules are to match transactions in the order of price priority and time priority, and directly realize the exchange between two cryptocurrencies. For example, BTC/USDT refers to the exchange between USDT and BTC.
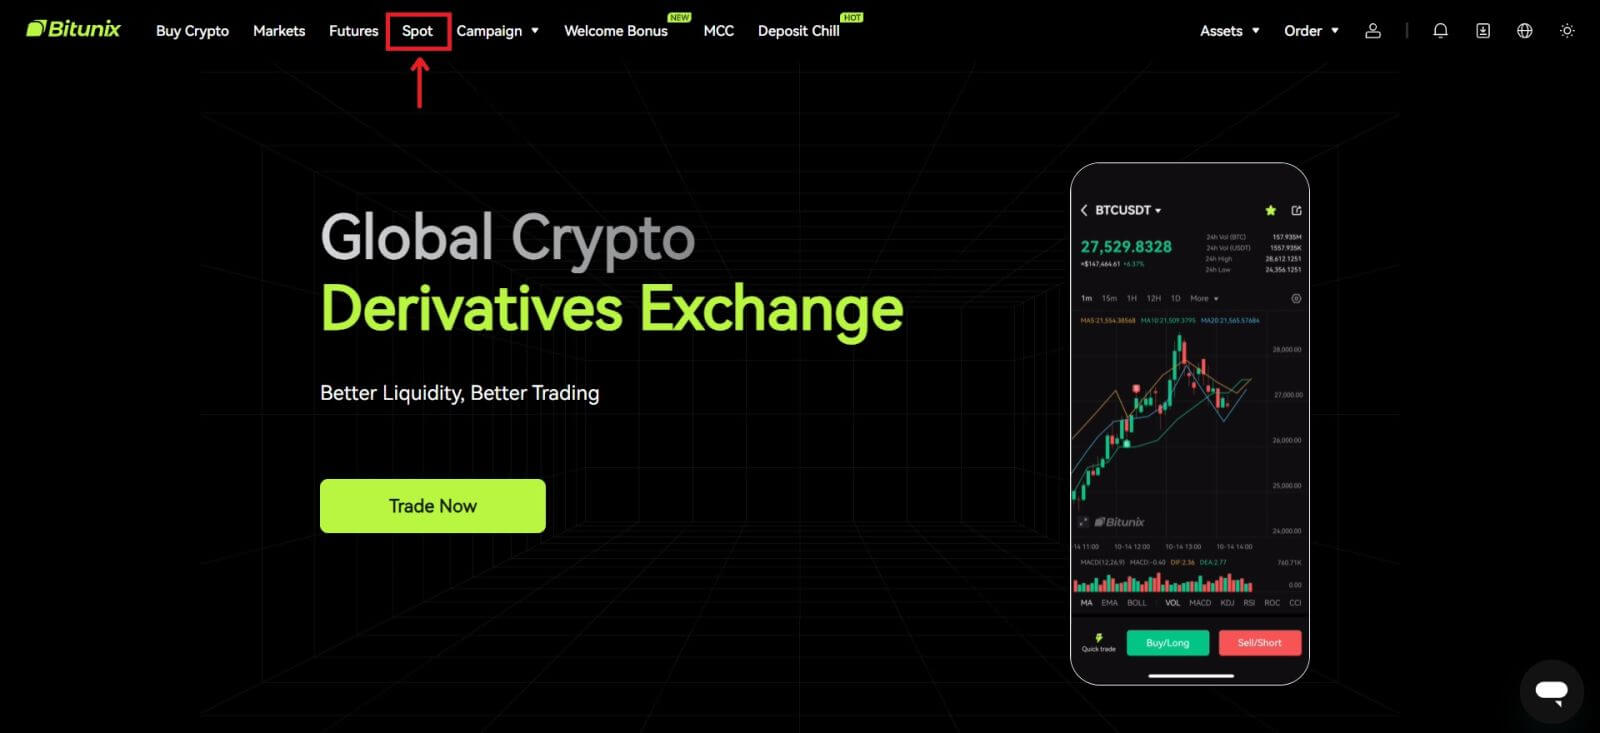
1. Log in to your account on Bitunix, click [Spot].
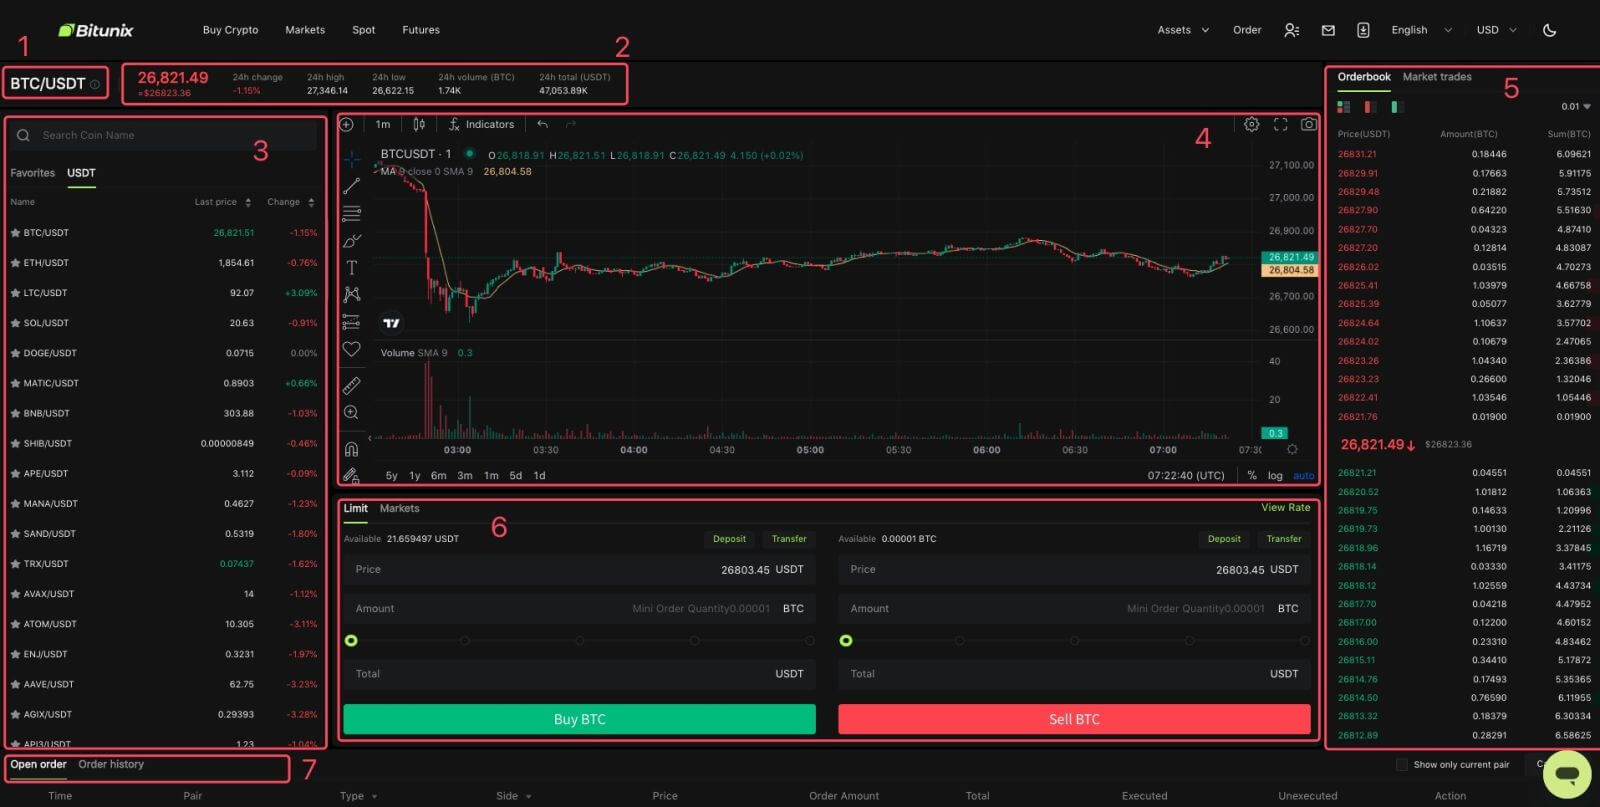
 Spot trading interface:
1. Trading pair: Shows the current trading pair name, such as BTC/USDT is the trading pair between BTC and USDT.
2. Transaction data: the current price of the pair, 24 hours price change, highest price, lowest price, transaction volume and transaction amount.
3. Search area: users can use the search bar or directly click the list below to switch the cryptos to be traded
4. K-line chart: the current price trend of the trading pair, Bitunix has a built-in TradingView view and drawing tools, allowing users to select different indicators for technical analysis
5. Orderbook and Market trades: real-time order book order book and trading situation of the current trading pair.
6. Buy and Sell panel: users can enter price and amount to buy or sell, and can also choose to switch between limit or market price trading.
7. Order information: users can view the current open order and order history for previous orders.
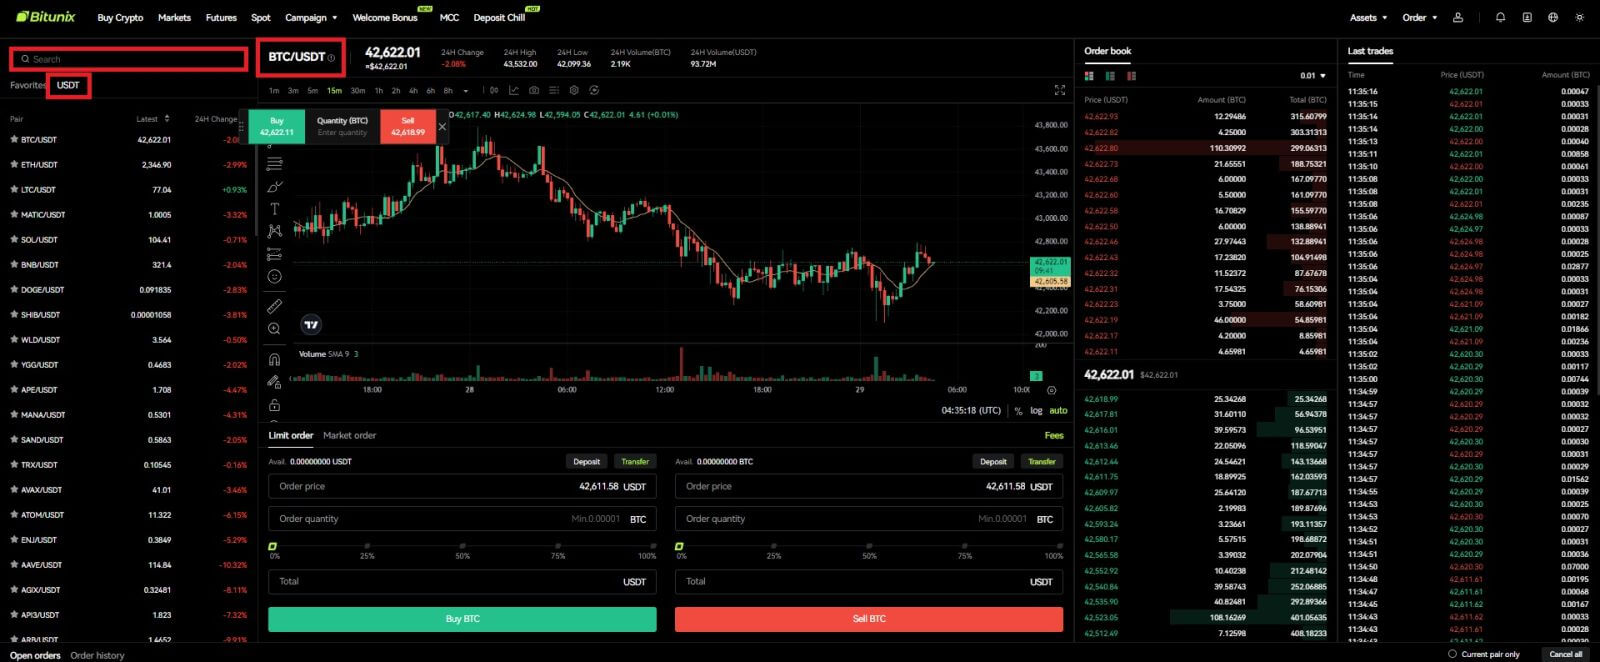
2. On the left side, search BTC, or click BTC/USDT in the list.
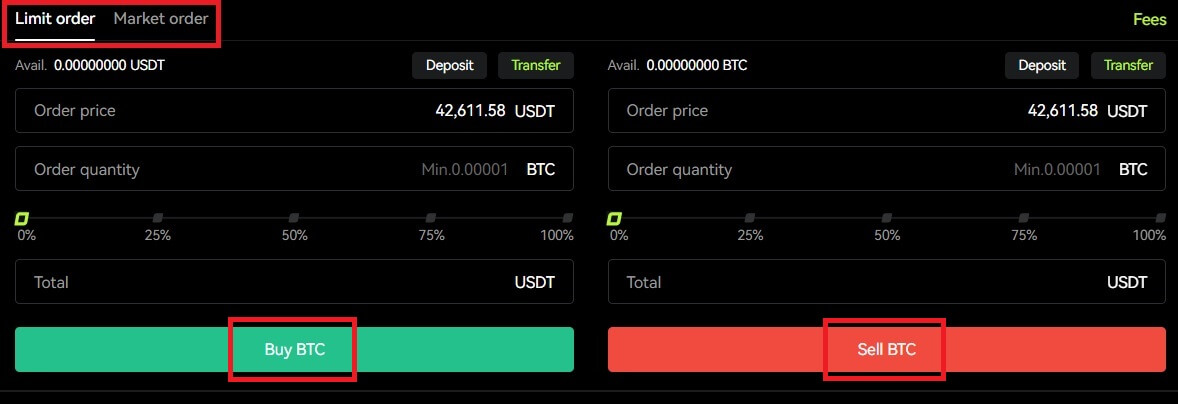
3. At the lower part of the page, select “Limit” or "Markets" order.
If users choose the limit order, then they need to enter both price and amount before they can place the order.
If users choose the market order, then they are only required to enter the total value in USDT as the order will be placed under the latest market price. If users choose to sell with market order, only the amount of BTC to sell is required.
To buy BTC, enter the price and amount for limit order, or just enter the amount for market order, click [Buy BTC]. If you are selling your BTC for USDT, then you should use the one on the right and click [Sell BTC].
 4. If a limit order is not filled immediately, you can find it under "Open Order", and cancel it by clicking [Cancel].
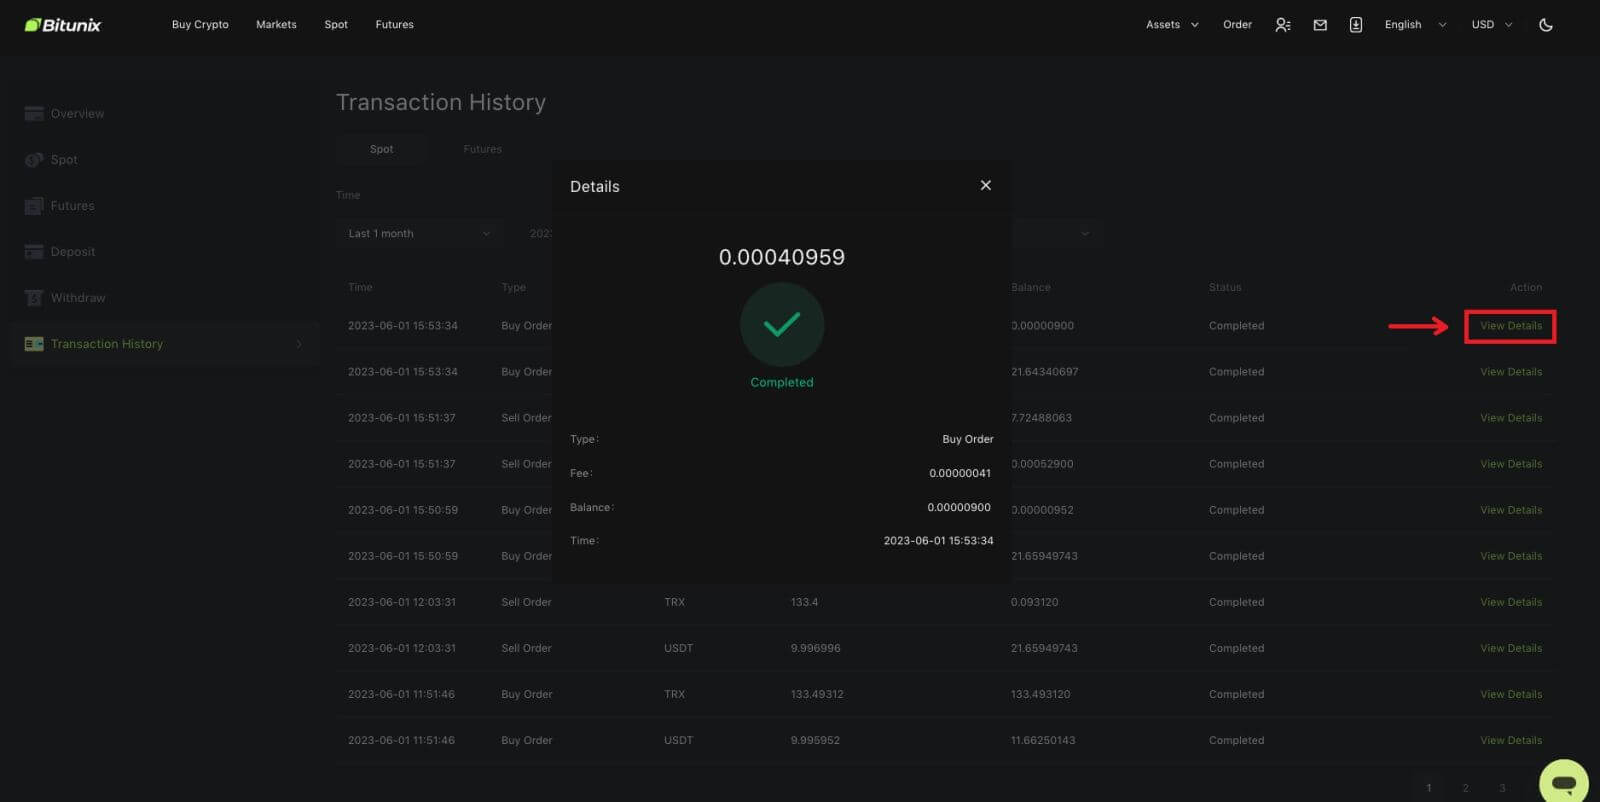
 5. Under “Order History”, users are able to view all their previous orders including their price, amount, and status, under “Details”, users are also able to view the fee and the price filled.

How to Trade Spot On Bitunix (App)
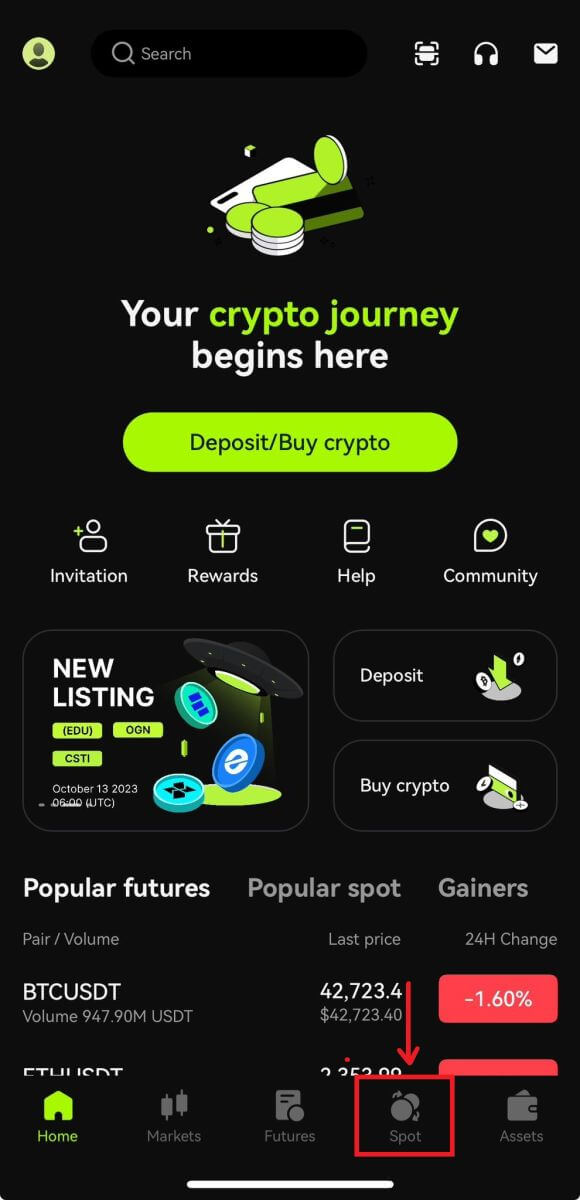
1. Login to your Bitunix account on the mobile application, select [Trade] at the bottom.
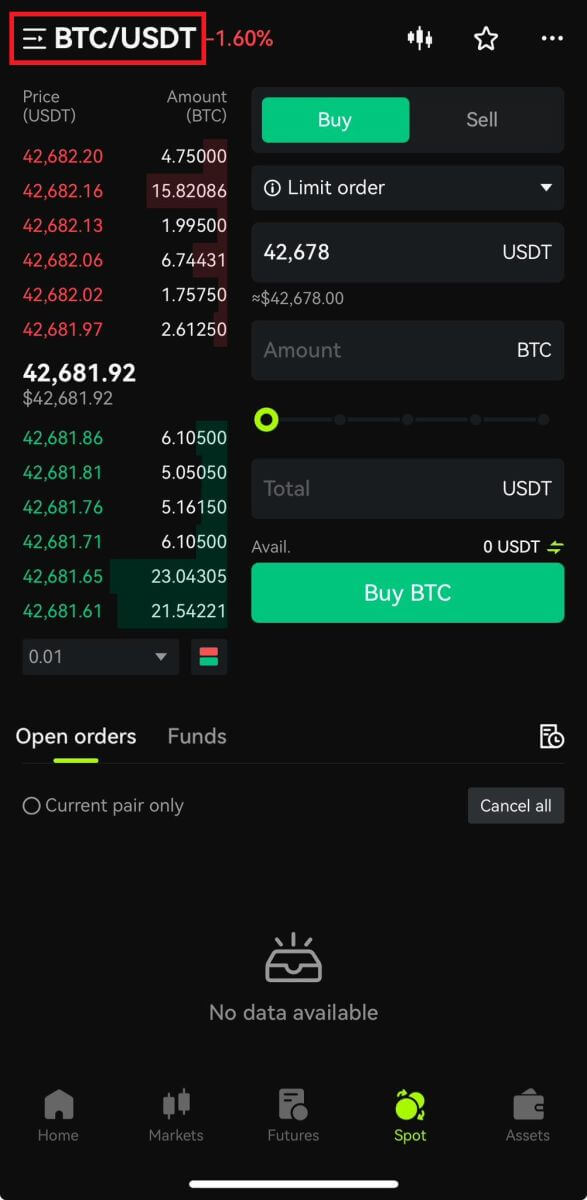
 2. Click [BTC/USDT] on the top left to change trading pairs.
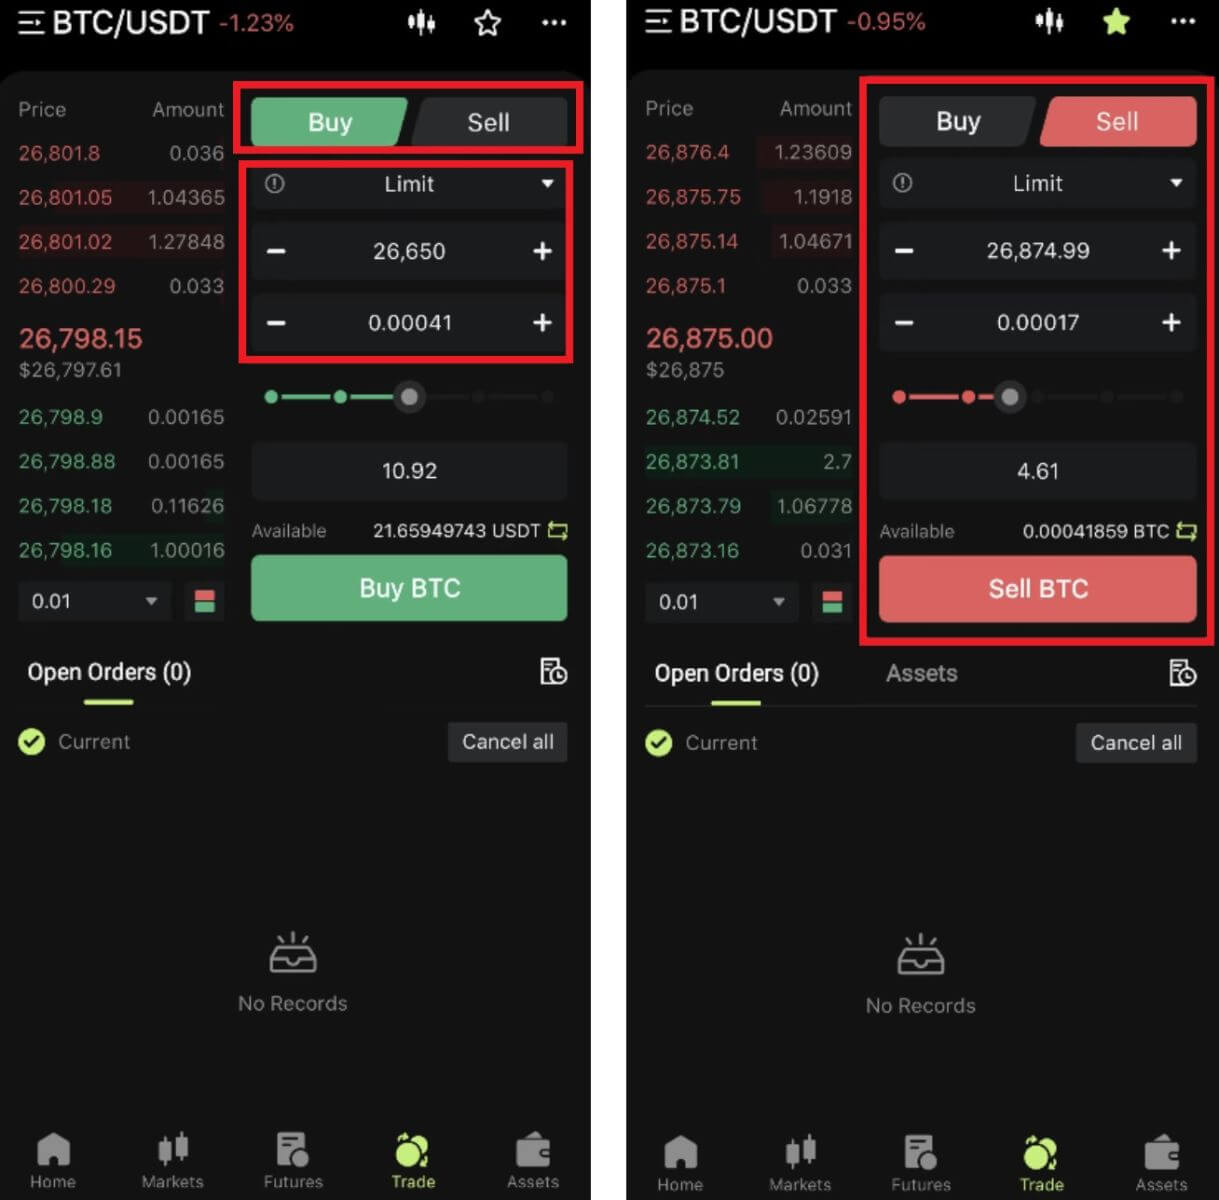
 3. Select your order type on the right side of the page.
If you choose limit order, you need to enter the buy price and quantity in turn, and click buy to confirm.
If you choose market order to buy, you only need to enter the total value and click Buy BTC. If you want to sell with market order, you will need to enter the amount you are selling.
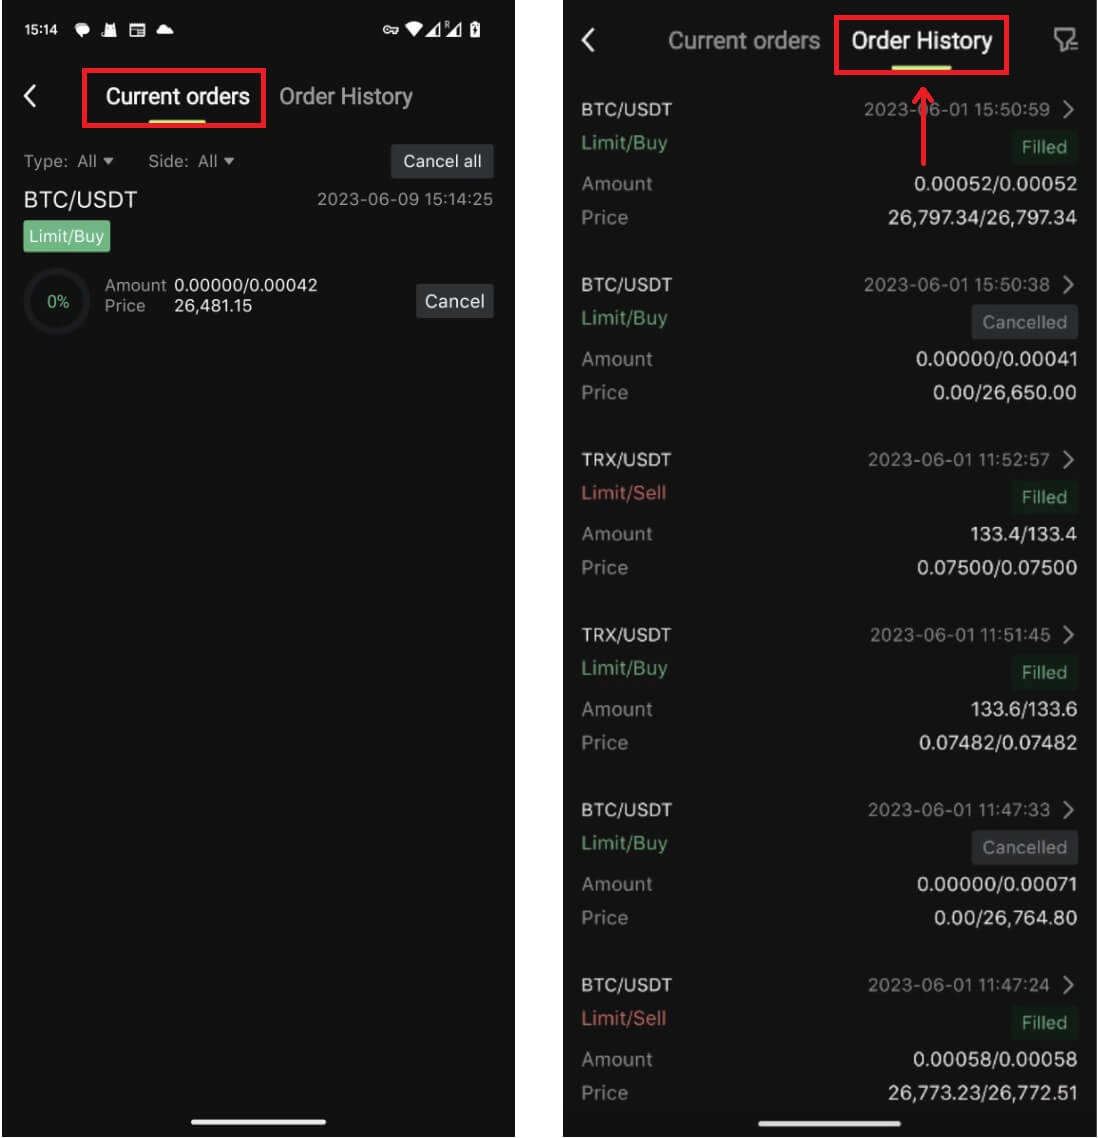
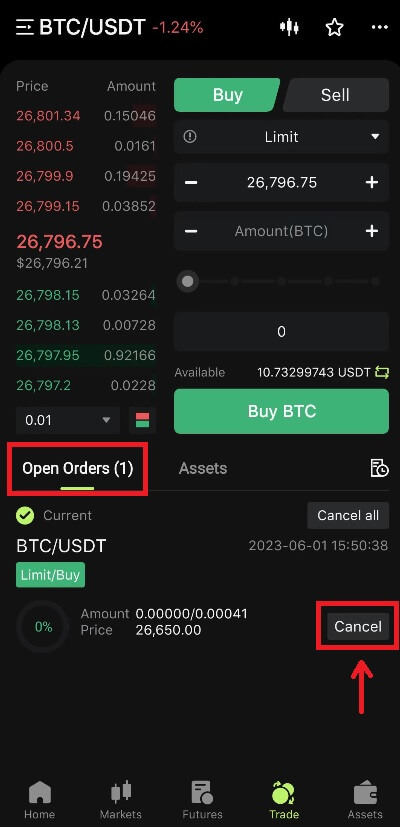
 4. After placing the order, it will appear in Open Orders at the bottom of the page. For unfilled orders, users can click [Cancel] to cancel the pending order.
5. Enter the order history interface, the default display current unfilled orders. Click Order History to view past order records.
 What are limit order and market order
Limit Order
Users set the buying or selling price by themselves. The order will only be executed when the market price reaches the set price. If the market price does not reach the set price, the limit order will continue to wait for the transaction in the order book.
Market Order
Market order means that no buy price is set for the transaction, the system will complete the transaction based on the latest market price at the time the order is placed, and the user only needs to enter the total amount in USD wants to place. When selling at market price, user needs to enter the amount of the crypto to sell.
Frequently asked Questions (FAQ)
What is the candlestick chart?
A candlestick chart is a type of price chart used in technical analysis that displays the high, low, open, and closing prices of a security for a specific period. It is widely applicable to the technical analysis of stock, futures, precious metals, cryptocurrencies, etc.The high, low, open, and closing prices are the four key data of a candlestick chart that show the overall price trend. Based on different time intervals, there are one-minute, one-hour, one-day, one-week, one-month, one-year candlestick charts and so on.
When the closing price is higher than the open price, the candlestick will be in red/white (supposing red for rise and green for fall, which can be different based on different customs), suggesting that the price is bullish; while the candlestick will be in green/black when the price comparison is the other way around, indicating a bearish price.
How to View Transaction History
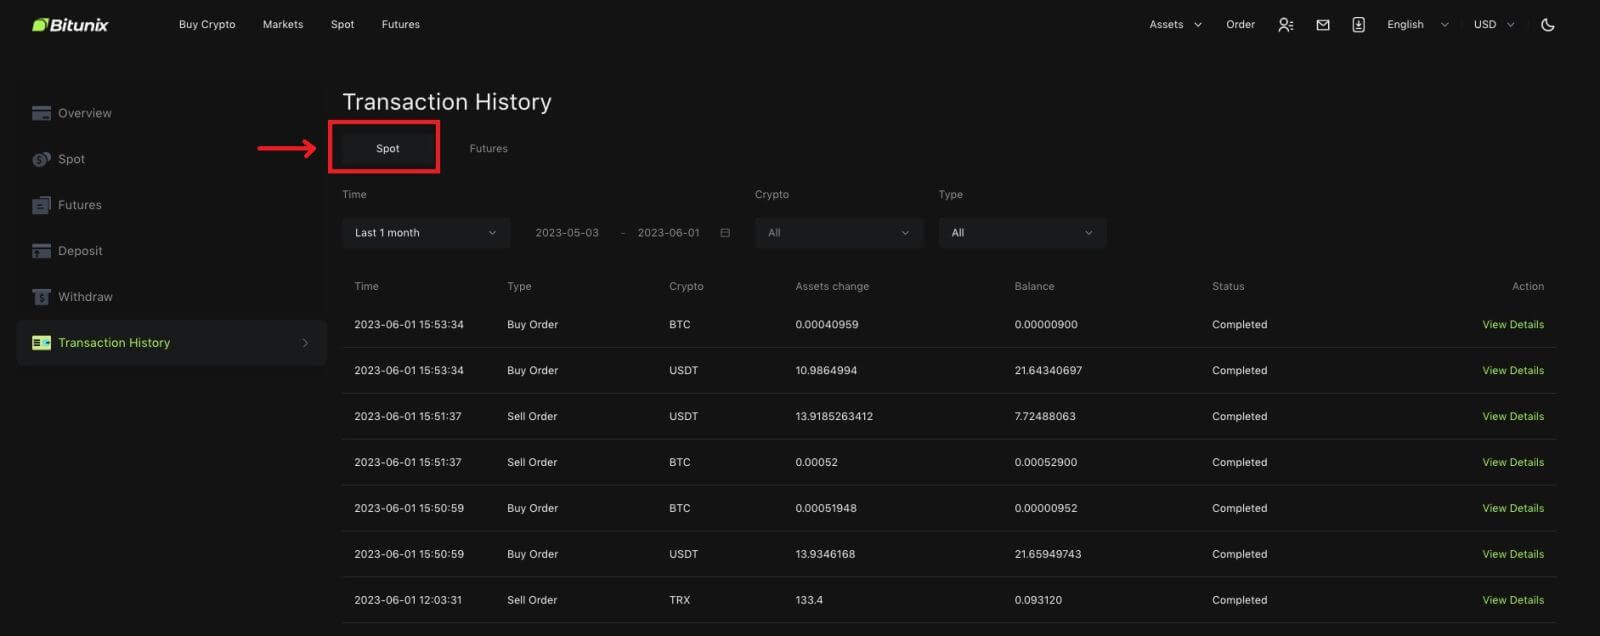
1. Log in to your account on Bitunix website, click [Transaction History] under [Assets].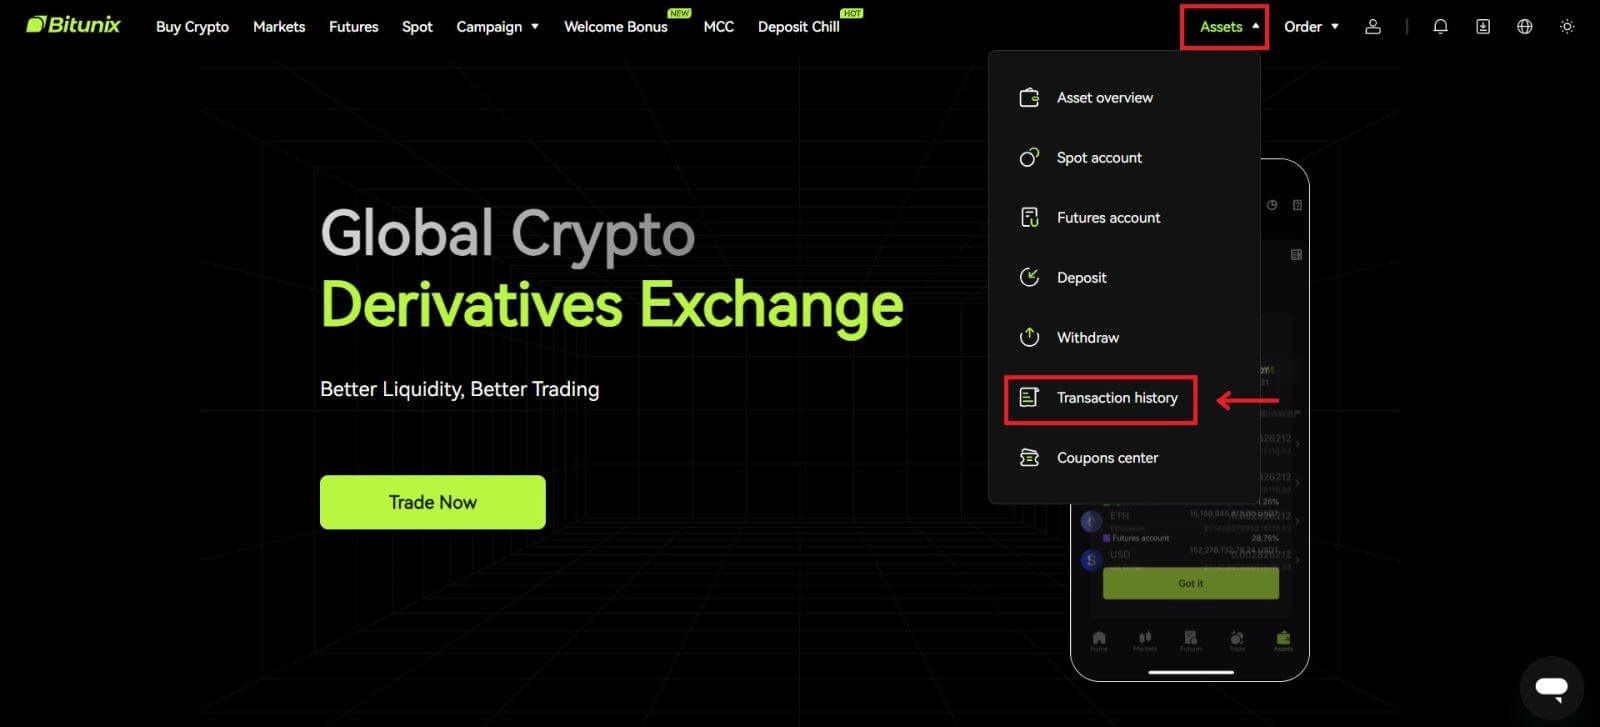 2. Click [Spot] to view transaction history for spot account.
 3. Users can select time, crypto and transaction type to filter.
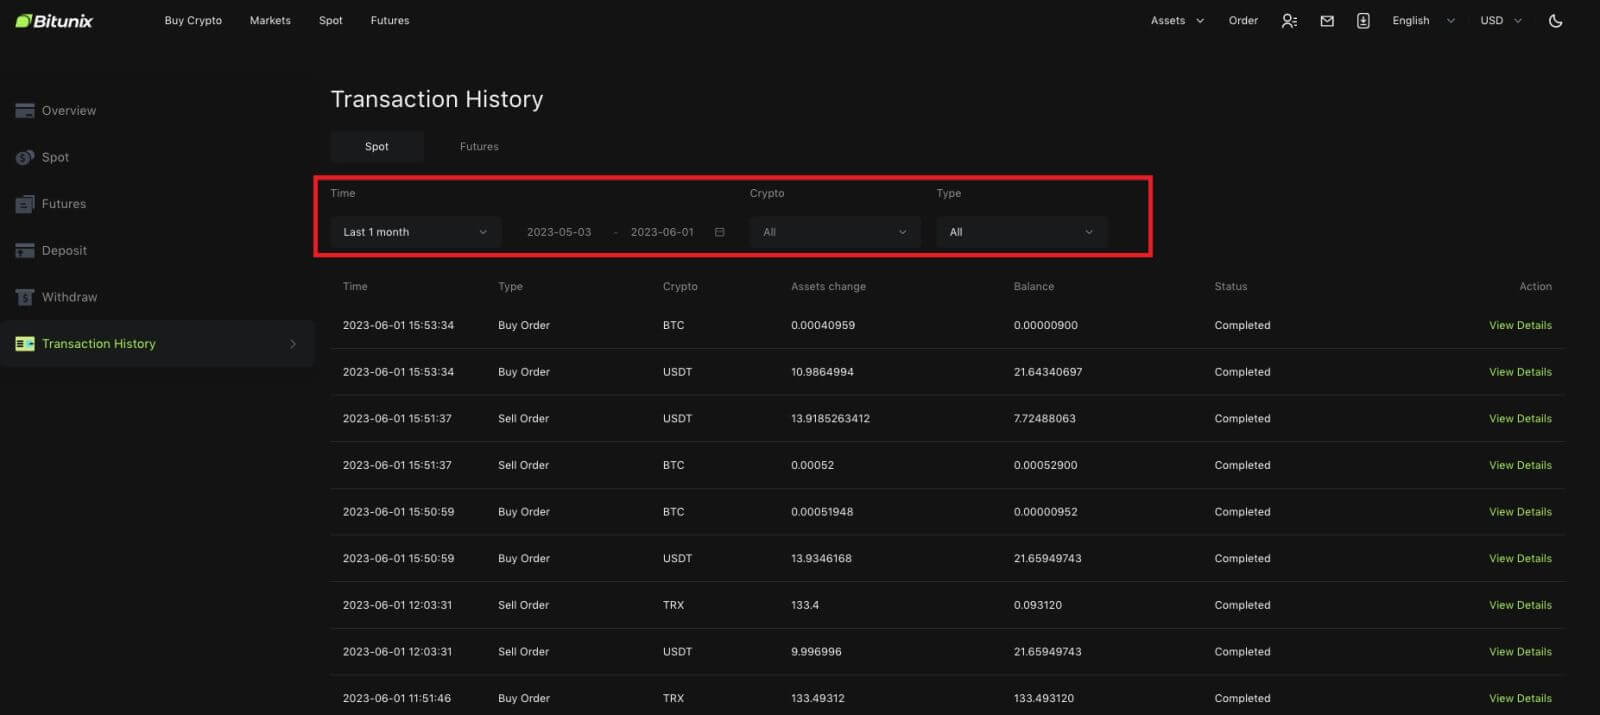
4. Click [View Details] to check the details of a specific transation.
